Are you using your machine to its full capabilities?
4 minutes read
This story starts with me being annoyed: I felt like my laptop was getting slower and slower, e.g. when compiling my Rust projects. My whole sway session would become sluggish with very low FPS, crappy audio. Now when the system is under 100% load I understand that things tend to get slow, but that was very recurrent and pretty intense.
At first, I attributed this to my laptop slowly aging, maybe I installed too much bloat and it was somehow making it slow.
After some time, it started to get really frustrating and I decided to fully investigate and find what was going on.
Since I have a 4k monitor and only an iGPU, I thought this might be the cause for the lag, so I made a pretty basic search: "Linux 4k monitor sluggish".
After a couple of results, I stumbled upon an interesting thread on the framework laptop forum:
This particular thread links to another post with the title "12th gen - excessive CPU throttling on Linux - Can’t get above 46c and pegs to 400mhz under load":
OP noticed that when his system is under heavy load, his CPU would get pretty severely throttled, all his cores would drop to 400MHz.
He was using a tool I didn't know about: s-tui:
- https://github.com/amanusk/s-tui
s-tuiis a "Terminal-based CPU stress and monitoring utility".
It looked like a really useful tool. When I was investigating, I was using utilities like top/htop to monitor the CPU and nvtop to monitor my iGPU but that's pretty much it. I didn't even think about checking my CPU cores frequency, and none of these tools show it by default.
This made me learn that htop is very configurable! If you press F2, you can configure what data to display, the layout etc.
Because I'm a NixOS user (btw), I configured htop declaratively in Nix syntax via home-manager:
{ pkgs, config, ... }:
{
  programs.htop = {
    enable = true;
    package = pkgs.htop-vim;
    settings = {
      show_cpu_frequency = true;
      show_cpu_temperature = true;
      highlight_base_name = true;
      show_program_path = false;
      hide_userland_threads = true;

      fields = with config.lib.htop.fields; [
        PID
        USER
        M_RESIDENT
        PERCENT_CPU
        COMM
      ];
    }
    // (
      with config.lib.htop;
      leftMeters [
        (bar "AllCPUs")
        (graph "CPU")
      ]
    )
    // (
      with config.lib.htop;
      rightMeters [
        (bar "Memory")
        (bar "Swap")
        (text "Zram")
        (text "Tasks")
        (text "LoadAverage")
        (text "Uptime")
        (text "Systemd")
        (text "Battery")
        (graph "GPU")
      ]
    );
  };
}
The interesting config option here is show_cpu_frequency = true.
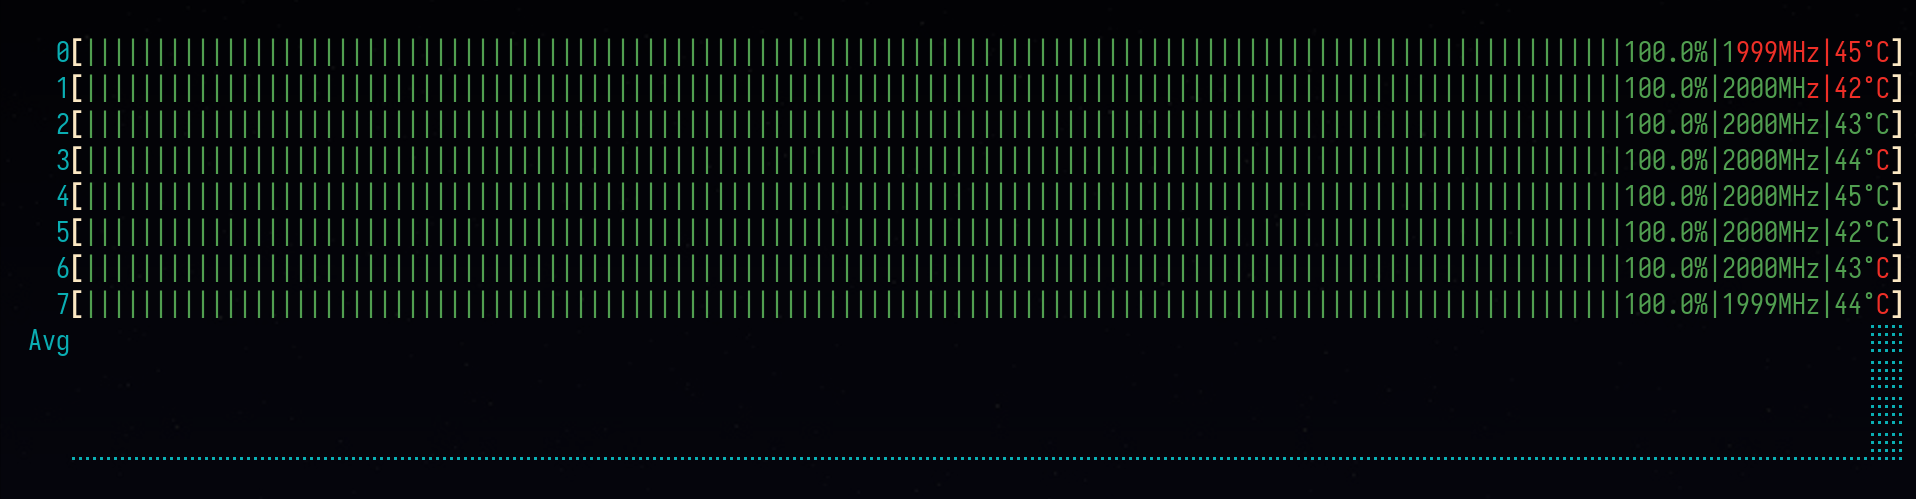
I then started a CPU stress test, opened htop and surprise:
Test 1:
Test 2:
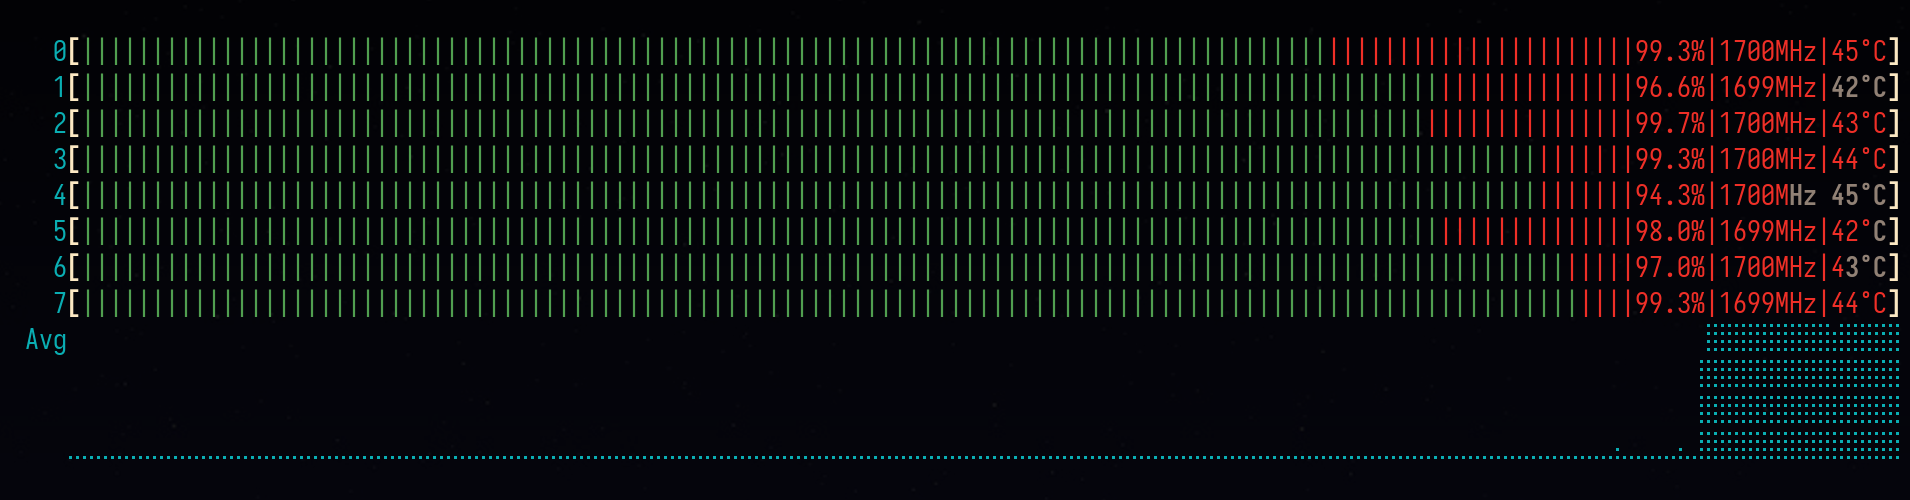
Same exact problem! The throttle is less hardcore, but all my cores drop to about 1500-2000MHz, sometimes less even though the temperatures are very low (less than 45˚C)
I was a bit stunned: Under heavy load, I was actually using my laptop to 50-60% of its capabilities (2000MHz vs ~3800MHz for the specs of my laptop without turbo boost) for at least a couple of months now.
No wonder my system felt slow: all cores were running to a pretty low speed when the exact opposite is required under heavy load. Throttle is acceptable and required when CPU cores temperatures get too high, but this makes no sense.
This behavior is very inconsistent, after reboot it would sometimes throttle to 2800MHz, sometimes less, sometimes more.
The Fix
In the thread that lead me down this rabbit hole it looks like updating their firmware did the trick, but my firmware was already updated.
What actually fixed it for me was using throttled, a tool that was created to fix this exact problem:
On NixOS, this is a simple as:
services.throttled.enable = true;I now live happily with a snappy system and no throttling. It's honestly night and day, the same sensation as when you install an SSD on an old HDD machine.
Conclusion
This adventure served as a reminder to:
- regularly compare your machine performance with its specs to use your machine to its full capabilities.
- know your system monitoring tools and how to use them:
s-tuiand a properly configuredhtopdid the trick for me